
The Mullet Portfolio
The 60/40 is failing again. Why is anyone still surprised?

Itai Lourie, CFA | Thresher Fixed LLC | March 2026
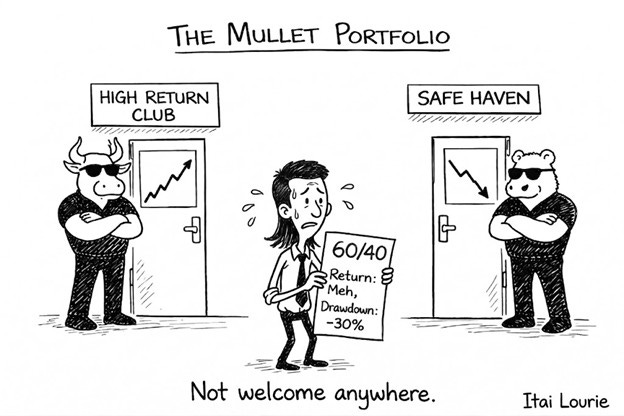
“It may be that no one ever stuck religiously to the 60/40 stocks/bonds mantra, but it has been the received wisdom pretty much forever. It’s the mullet haircut of asset allocation: sensible up top with the bonds, party at the back with the stocks.” -- Katie Martin, Financial Times, March 2026
I love this quote. Katie Martin is top of the game when it comes to distilling the market noise and is very funny. Check her out on Bluesky and the Financial Times.
Asset management has been selling this style for close to forty years and it still looks awful. Packaging returns and diversification with a head-on view at the serious side while missing the fact that over the long-term it robs you of return and it has no real downside protection. You’d be better off with cash.
To read the headlines and commentary on the 60/40 you’d think that 2022 was some black swan that swooped out of the sky one hundred years ago and flew off just as quickly. Returns were like a smooth pond and the swan splashed about and then left the water to settle back to equilibrium.
A recent piece in the FT warned of “nowhere to hide” as global stocks and bonds suffer their biggest combined sell-off since 2022, suggesting the problem is the Iran war energy shock. It isn’t. The problem is the strategy. It has always been the strategy.
2022 wasn’t an anomaly. 2026 isn’t a surprise. Same structural failure. Different window dressing.
The numbers
Year to date, through late March 2026:
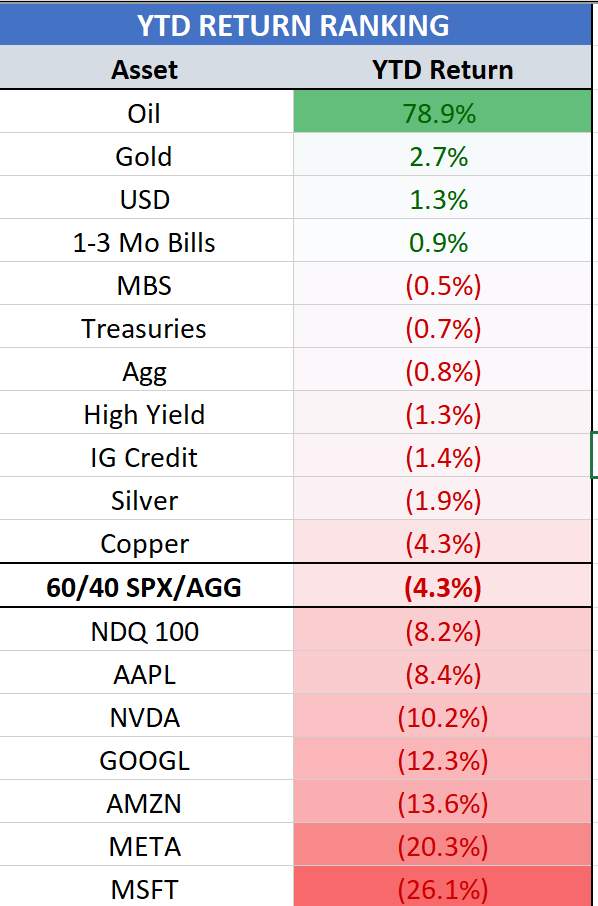
The 60/40 investor, 60% S&P 500, 40% AGG, is down 4.3% on the year. The Aggregate contributed nothing. Gold is up 3%. Real assets are up double digits.
This is 2022 with a different catalyst. The construction failure is identical.
The mullet
The metaphor is funnier than it deserves to be. The 60/40 portfolio does look like a mullet. Conservative framing up front. All the risk buried in the back. Works fine until you have to show up somewhere that matters.
I wrote this last year and nothing needs updating:
“The 60/40 portfolio is a blunt instrument. Dump equities and bonds into a pot, stir once and forget about it, then call it diversification. A kitchen-sink approach to asset allocation.”
The pattern is the same every time it breaks. Panic. Rotate into whatever alternative is hot. Privates last cycle. Real assets this one. Or better yet, do nothing and listen to the conventional wisdom that market timing is for the birds.
That advice is fine if you are one of my twenty-something year old kids sitting in 100% risk assets. I would heartily concur. The problem is anyone in the 60/40 is sitting in something that promised something else. They will endure the volatility without the rocket upwards when the correlation regime flips back.
Stop obsessing over correlations
When the 60/40 breaks, the narrative collapses to correlations. Stocks and bonds moved together. Diversification failed.
It’s a bit of a red herring.
The S&P 500 and the US Aggregate have had a long-term correlation of roughly 25% over the past 50 years. Both asset classes tend to move in the same direction. Beyond that, not much.
Correlations describe direction, not magnitude. If your stocks fall 30% and your bonds rise 2%, so what? You might as well own rocks.
Magnitude matters. Not correlation. Time horizon matters.
Look at the 5-year rolling correlation of the S&P 500 and the Agg. Smooth line, clear regimes. Looks useful. Now look at the 1-year rolling version. Noise. Swings from negative to positive within a year. No usable signal in that chart.
Correlations are backward-looking. By the time you identify the regime, you are already in it.
[IMAGE 3: Rolling correlation chart]
An important caveat. Negative stock-bond correlation did work for roughly two decades, from the late 1990s through 2020. If you were running a 60/40 during the era of anchored inflation expectations and declining real rates, the construction did what it was supposed to do. That era is over. Inflation is above target, fiscal deficits are structural, and the Fed is constrained. The macro regime that made the 60/40 look brilliant is not the macro regime we are in.
The Aggregate is the wrong bond allocation
This is the argument the bond management industry does not want to have.
The US Aggregate Index is roughly a third corporates, a third Treasuries, a third mortgages. Thirty trillion dollars of diversification. Low credit risk, steady income, lots of complexity. A perfectly fine benchmark for pension funds matching specific liabilities.
For a growth-oriented investor trying to offset equity risk it is pretty much useless.
Over 15 years, 2011 through 2026, swapping the Agg for cash delivered near identical results, with better downside protection and lower volatility.
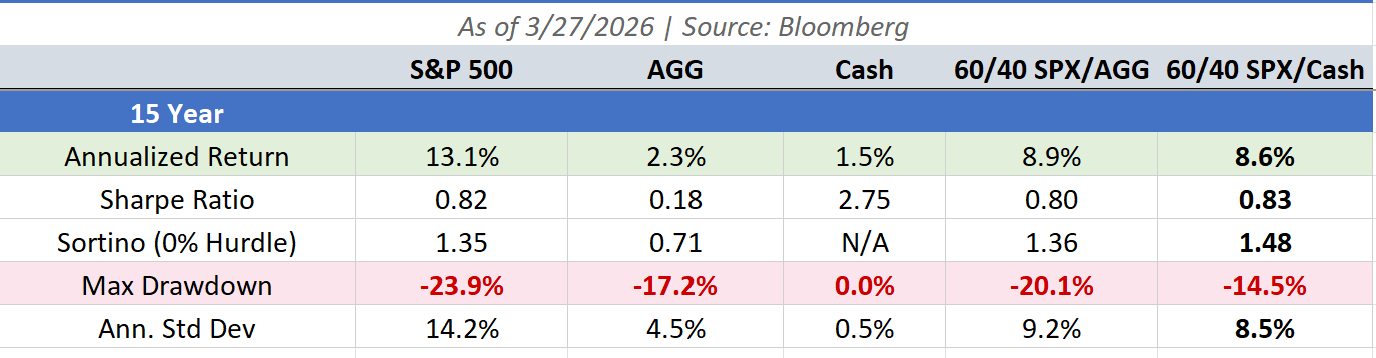
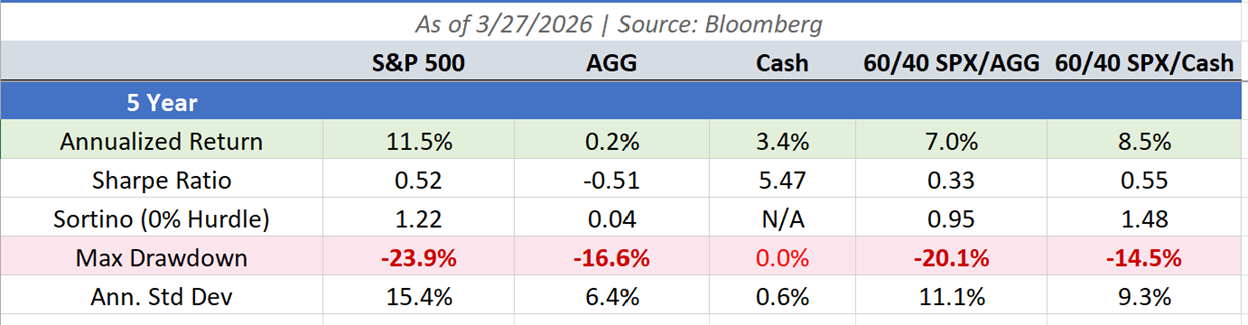
And that’s the good look for the Agg in the 60/40. Over shorter time frames, cash handily outpaces the Agg.
The entire bond manager apparatus, credit analysts, yield curve frameworks, bottom-up fundamental research, delivered the same outcome as sitting in cash.
That is not alpha. That is noise dressed up as process.
The composition of the Agg makes it worse. Close to 70% of the index is Treasuries and Agency MBS. Neither generates much in the way of excess return.
I ran this data earlier in the year around Trump’s Davos comments on buying Agency MBS:
5 years, through January 2026:
MBS +0.70% (Annual return)
Corporates +1.14%
Treasuries +0.02%
Aggregate +0.59%
Cash +2.80%
Mortgages are a third of the Agg. Slightly better than Treasuries over five years. Negative convexity, prepayment complexity, persistent OAS model anxiety. Investors are subsidizing homeowners. Very altruistic. Not very capitalistic.
A cynical person might think that outside of corporates the rest of the Agg is just there so fixed income managers can look smart and beat the benchmark. I’ve addressed this with others, including AQR, in my piece on Core Alpha. Elusive Alpha in Fixed Income
The equity allocation runs the show
The return stream of a balanced 60/40 strategy has a 98.5% correlation to a pure equity allocation. The Agg’s low volatility makes the bond sleeve invisible when equities move.
Some reduction in volatility. No meaningful left-tail protection when it counts:
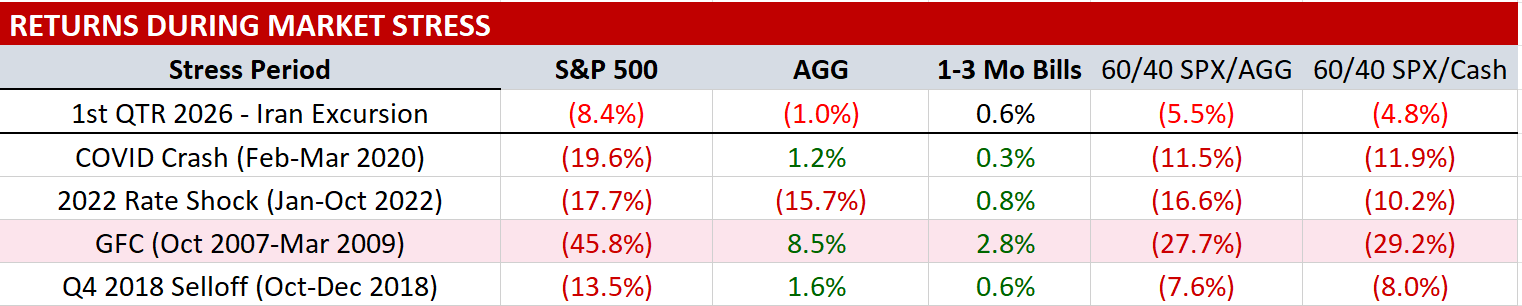
In the worst equity drawdown of the modern era, the 60/40 lost 28%. The S&P lost 46%. You gave up 270 basis points of annualized return for 18 points of peak drawdown reduction.
Bad trade.
You need more volatility in your bond allocation. Not less. The Agg is too tame to do real work.
For more on this, I wrote a longer piece last year: Rethinking Public Market Exposure for a Post-60/40 World. The short version: adding long duration and dynamic quant modifiers like momentum are straightforward fixes to a broken blended benchmark.
Where this leaves us
The 60/40 is broken in 2026 for the same reason it broke in 2022. The construction is wrong. The bond sleeve is the wrong ingredient, managed in the wrong way, against the wrong benchmark.
The path forward has three components.
Better ingredients. Long Treasuries over the Agg. Real assets as an explicit inflation-sensitive allocation. Stop burying credit and mortgage risk in a blended benchmark that can’t offset equity vol.
Dynamic overlays. A single-factor momentum rule reduces max drawdown from 32% to under 10% and correlation to equities from 98% to 55%. That is not incremental. That is structural. These tools exist. They are not new. They are just not standard practice in balanced mandate construction, which tells you more about the industry than the tools.
Regime awareness. 2022 and 2026 are the same macro regime. Inflation above target, rates elevated, equity multiples under pressure. Static allocations fail here. Dynamic ones adapt. The question for allocators is not whether the 60/40 will break again. It will. The question is whether you want to keep pretending the mullet is a haircut or admit it is a risk management failure.
Disclosures
This publication is for informational and educational purposes only and does not constitute investment advice or a solicitation to buy or sell any security. All performance data shown is historical. Past performance does not guarantee future results. Thresher Fixed LLC may hold positions in instruments discussed herein. Views expressed are those of the author and subject to change without notice.