
Scenario Analysis 101 - Iran War Room
How to make some macro sense of another Mideast War

Scenario analysis is a critical tool in assessing both expected return and risk, particularly when there are events with discrete outcomes. Will the market read the Fed as dovish or hawkish on Wednesday? Will the market read Nvidia earnings as sufficiently amazing?
Seems simple but it can be devilishly difficult. Each possibility has branches and some of those branches are genuinely hard to quantify. Scenario analysis can be like getting a weather forecast. With a fifty percent chance of showers, you bring your umbrella and congratulate yourself on your foresight but find the rain coming sideways. Should have taken an Uber.
The problem isn’t the probability. It’s that probability without payoff structure is just a number. A 30% scenario with a 20% move matters more than a 70% scenario that moves it 2%.
We built a robust scenario analysis tool around the US-Iran conflict on day one for two reasons:
To rigorously assess the risks inherent in our positioning
To identify mispriced assets and tactical opportunities
We are sharing a version of that scenario analysis in an app that will allow you to track the changing face of the war and the implications of those changes for a few assets. You can find the app launch button at the bottom of this post.
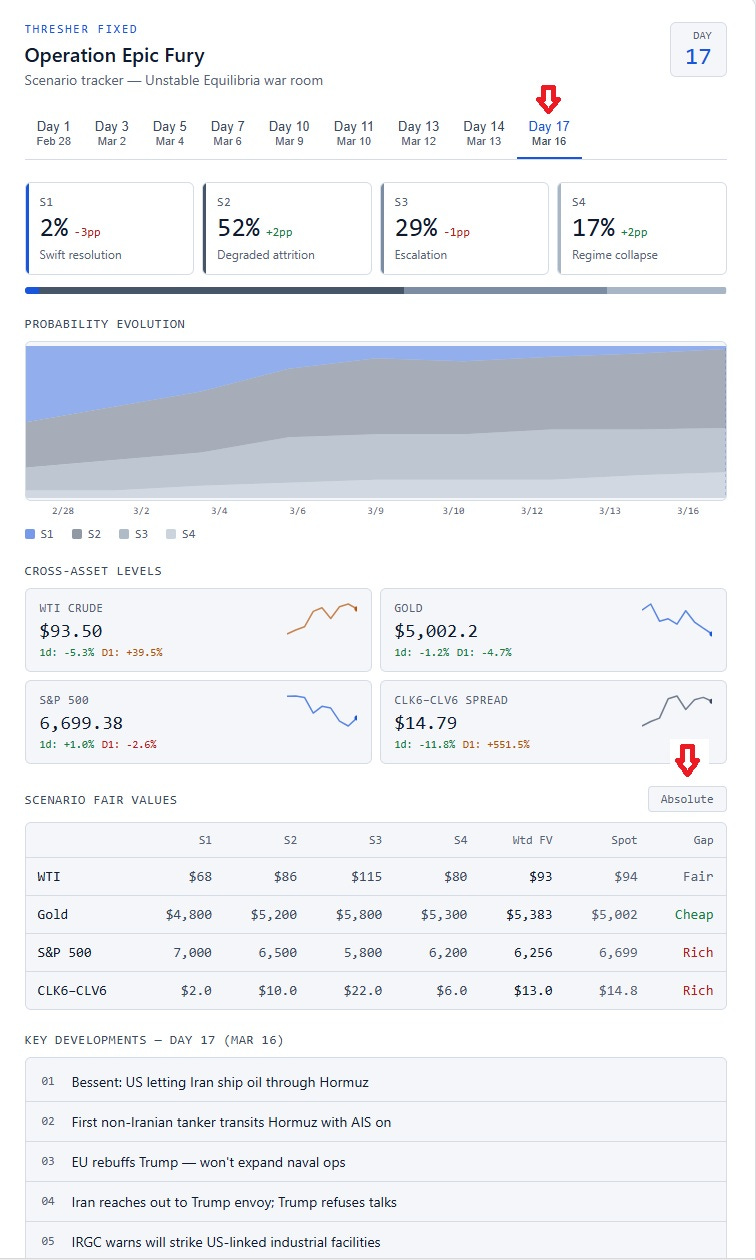
Four scenarios.
S1: swift resolution — a face-saving pause, Hormuz reopens in weeks.
S2: prolonged attrition — the base case, a grinding air campaign with intermittent Hormuz disruption.
S3: regional escalation — Gulf states pulled in, infrastructure targeting, Hezbollah activation.
S4: regime collapse — internal fracture, IRGC splinters, outcomes become non-linear.
Each scenario carries a probability.
Probability-weighted fair values update across:
Oil (WTI)
Gold
S&P 500
Oil calendar spreads (shape of the oil curve)
The probabilities updated daily as facts changed. Diplomatic channels closing moved weight from S1 to S2. Hezbollah activation moved weight from S2 to S3. The market for an asset or spread occasionally lags a shift. That lag is the edge.
Currently you can pick a day and see probabilities and fair values on that day as well as key developments. You are also able to see fair value and price moves in % terms by clicking the Absolute button. Probabilities are Thresher generated but I might allow user input here at some point.
Expect updates at the close and sometimes intraday.
If you are enjoying our content, please subscribe.