
Model Note: Three Metals, One Question

Three Metals, One Question
Thresher Fixed LLC · March 2026
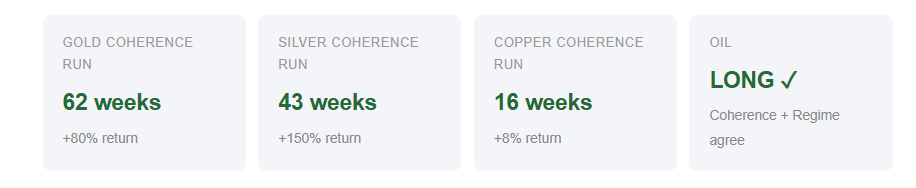
The Run
Gold had been positive on the Coherence Signal for 62 consecutive weeks when the Regime Signal turned negative on March 11th. Over that run, gold returned +80%. Silver had been positive for 43 consecutive weeks, returning +150%. Both are the longest Coherence Signal runs on either metal in over 30 years of data. Every prior gold run has been shorter. Every prior silver run has been shorter.
In 2025, gold surged 66% and silver 135% — gold’s strongest annual performance since 1979. The Coherence Signal was positive through most of it, running continuously since January 8th on gold and May 21st on silver.
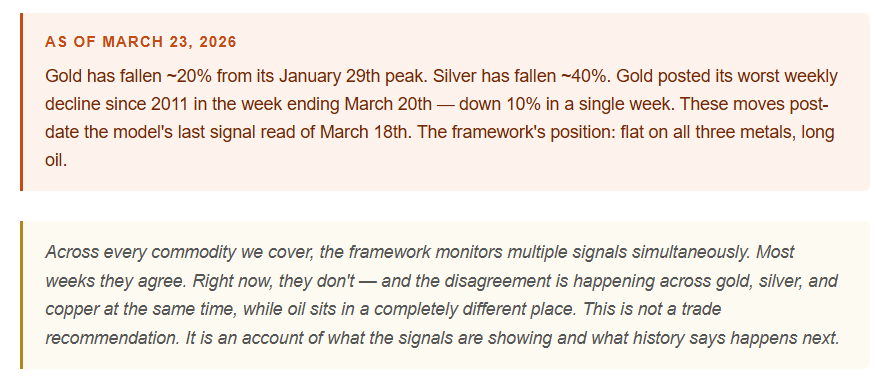
Then January 29th. Gold peaked at $5,400. Silver touched above $110. Both set all-time records. Within days, both began falling. As of March 23rd, gold has fallen roughly 20% from its peak. Silver has fallen approximately 40%. Gold posted its worst weekly decline since 2011 in the week ending March 20th.
What the Signals Did
The Regime Signal is the slow one. It reads the long-arc structural environment — months of price behavior, volatility patterns, the weight of accumulated evidence. It does not react to a single bad week. The Coherence Signal is faster — it reads whether price is trending in the same direction across short, medium, and long timeframes simultaneously.
The natural expectation is that Coherence breaks first and Regime confirms later. A faster signal should lead. But across 30 years of data and 309 episodes across the three metals, Regime leads 93–95% of the time. Coherence follows.
Why? The Regime Signal turning negative means the structural conditions it was reading were deemed to be deteriorating. The signal is slow to move but once it moves, it confirms the regime. The Coherence Signal, reading current momentum, can remain positive for weeks after the structural read has shifted — because a 62-week momentum run does not disappear overnight.
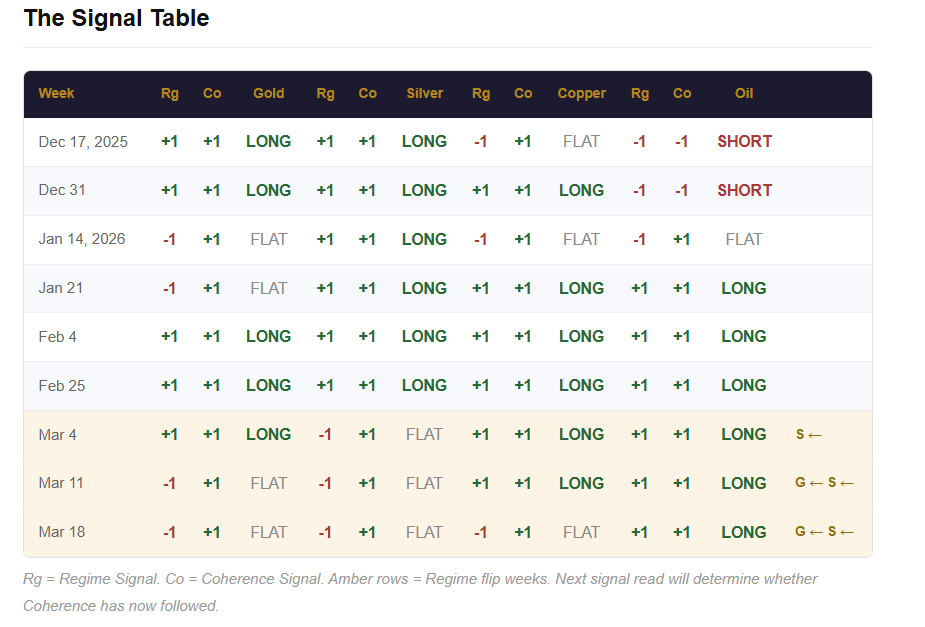
The result as of March 18th: the two signals cancelled each other out on all three metals — no position held. The framework stepped aside before the worst of the selling. Oil: both signals fully positive, position long, +75% since January 21st entry.
A Paradox Worth Naming
The Regime Signal turned negative on gold twelve separate times in the twelve months before March 2026. Twelve flips. Each time, the Coherence Signal stayed positive and overruled it. Gold went from $3,500 to $5,400 during those twelve months.
The Regime Signal was wrong — or at least very early — for an entire year. It picked up on the extreme volatility across these metals.
This is the honest framing of the current situation. The same signal that missed eleven prior turns is now negative again. The question is not whether Regime leads and Coherence follows in general — history is clear that it does 93% of the time. The question is whether this is the one in twelve that matters, or the twelfth in a series of false starts.
Chart 1 shows this visually. Every red-shaded band is a week the Regime Signal was negative while Coherence held positive. The price kept going up through all of them.

Chart 1: Gold price (top) and Regime/Coherence signals (bottom bars), Jan 2024 – Mar 2026. Red shading = weeks Regime was negative. The Coherence Signal (blue bars) remained positive throughout 12 separate Regime flips before the current episode.
The 2015 Comparison
2015 is a cautionary tale. Gold, silver, and copper were all flat simultaneously while oil was long — identical surface signal state to today. But the structural context was completely different.
In April 2015, the Coherence Signal had been positive for exactly one week on each metal when the Regime Signal turned. One week. There was no run behind it, no accumulated returns, no evidence of sustained momentum. The split appeared immediately — a signal at inception, not a 62-week trend in a pause.
What happened next confirmed the difference. Oil’s Coherence Signal broke within one week of the metals episode ending. Oil fell 44% over the following six months. Gold and silver drifted lower for 17 more weeks. The entire commodities complex entered a bear market together.
Chart 2 shows both episodes side by side. The structural difference is visible immediately.

Chart 2: 2015 episode (left) vs 2025–26 run (right). In 2015 the Coherence Signal had 1 week of history when the Regime turned — gold fell 15%. Today it has 62 weeks of history and Coherence is still holding.
The most comparable historical precedent for gold now is copper in 1994–95: a 62-week Coherence run that saw the Regime Signal turn negative repeatedly over months before Coherence finally followed. When it did, the negative period lasted 5 weeks. Copper resumed higher.
What Happens After Coherence Turns Negative
When Regime leads negative and Coherence follows — the sequence now beginning — the median lag from Regime flip to Coherence flip is 4–5 weeks for gold and silver. Current lags: gold 2 weeks, silver 3 weeks. Both inside the normal window. Given this week’s price action, the next signal read will almost certainly show Coherence has followed.
Once the Coherence Signal turns negative, history across 150 gold episodes since 1992 is surprisingly reassuring. The median negative period lasts just 3 weeks. The 4-week return from the moment Coherence turns negative is positive 82% of the time, averaging +2.5%. The median time before at least one signal recovers to positive is 1 week. Silver and copper show similar patterns, though copper’s negative periods run slightly longer — median 5 weeks. The table below shows the full picture:
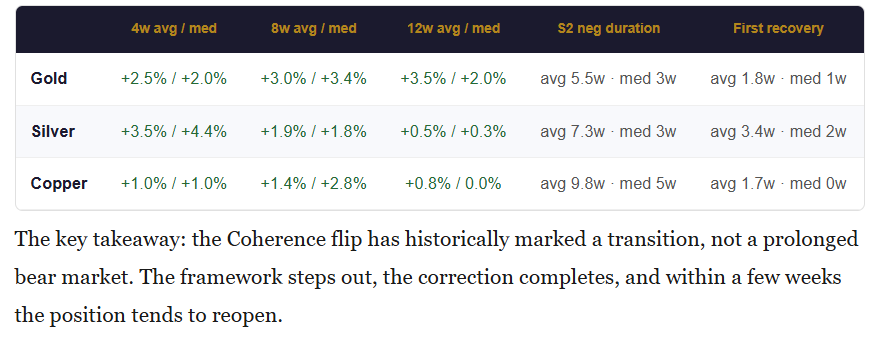

Chart 3: Cumulative return profile after Coherence turns negative on gold (150 episodes, 1992–2025). Green band = P25–P75 range. 82% of outcomes are positive in the first 4 weeks.
Oil Is the Condition That Changes Everything
Every historical case where metals recovered quickly after a Coherence flip had one thing in common: oil was long. In 2015 — the one case that turned into a genuine bear market — oil’s Coherence Signal broke within a week of the metals’ episode ending, and the entire commodity complex sold off together.
Right now oil is up +75% since January 21st and +44% in the past four weeks. Both signals fully aligned on oil. The Iran supply shock is creating a bid that separates oil from gold and silver structurally — and the framework reads them separately. Oil holding is the single condition that most distinguishes the current situation from 2015.
If oil’s Coherence Signal breaks before metals recover, the script changes materially. That has not happened. Until it does, the framework’s base case is a brief transition period, not a structural collapse.
What We Don’t Know
The framework has exited metals. It has not called them short. It is watching.
The two-sided question cannot be resolved from the data alone:
Pause or peak? Gold ran 62 weeks and returned +80%. Silver ran 43 weeks and returned +150%. Those runs had to end somewhere. The question is whether $5,400 gold and $110 silver were the end of the structural move, or waypoints in a longer trend that will reassert after a correction.
Regime right or Regime early? The Regime Signal missed eleven prior turns over twelve months while gold rose from $3,500 to $5,400. It may be calling the twelfth correctly. Or it may be in another extended period of false signals while Coherence eventually overrules it again. History says 93% of the time Coherence follows. But the 7% exception has happened eleven times already this year.
What history says with more confidence: when Coherence does turn negative, the median duration is 3 weeks for gold, and the 4-week return from that point is positive 82% of the time. The negative period is more often a floor than a continued decline. Recovery tends to come fast.
The conditions to watch: oil’s Coherence Signal, and whether the broader macro risk-off that has hit equities, credit, and rates reverses or deepens. The framework will report the moment either signal changes.
Thresher Fixed LLC. This is not investment advice.